🔍 Observability
Logging
Options you can use to control how WAHA outputs logs:
WAHA_LOG_FORMAT- supports formats:WAHA_LOG_FORMAT=PRETTY- good for local development, default formatWAHA_LOG_FORMAT=JSON- can be useful if you’re using a central logging management system
WAHA_LOG_LEVEL- how much information to logerror | warn | info | debug | trace.- 👉 Do not set
debugandtracein production, as these levels generate excessive log output.
- 👉 Do not set
WAHA_HTTP_LOG_LEVEL=info- controls the level ofrequest completedlog (HTTP access). You can set it toerror | warn | info | debug | trace.DEBUG=1- you can set this environment variable as a shortcut forWAHA_LOG_LEVEL=debug,DEBUG=1overrides theWAHA_LOG_LEVELtodebugif both defined.
Tracing
WAHA uses OpenTelemetry to correlate logs with HTTP requests:
- Every log line written while handling a request has
trace_idandspan_idfields, so you can find all the logs for a single API call. - Every HTTP response has a
traceparentheader (W3C Trace Context) with the same trace id, so the client can save it and look up the related logs later. - If the client sends a
traceparentrequest header, WAHA continues that trace instead of starting a new one.
👉 Traceparent: How OpenTelemetry Connects Your Microservices
is a good article explaining the traceparent header.
{
  "level": 30,
  "trace_id": "b992d8568c2ea3d2d3b135cc0cd322a6",
  "span_id": "4e4d4694dcbc1938",
  "msg": "request completed"
}traceparent: 00-b992d8568c2ea3d2d3b135cc0cd322a6-4e4d4694dcbc1938-01To pass your own trace id - send the traceparent header in the request:
curl -si \
  -H 'traceparent: 00-b992d8568c2ea3d2d3b135cc0cd322a6-4e4d4694dcbc1938-01' \
  -H 'X-Api-Key: yoursecretkey' \
  http://localhost:3000/api/server/version
The header must follow the 00-{trace-id}-{parent-span-id}-{flags} format:
trace-id- 32 hex characters, not all zerosparent-span-id- 16 hex characters, not all zerosflags-01(sampled)
If the header doesn’t follow the format, WAHA ignores it and starts a new trace.
By default it’s log correlation only - no telemetry leaves the server. WAHA sets these OpenTelemetry defaults (you can override any of them):
OTEL_SERVICE_NAME=waha
OTEL_TRACES_EXPORTER=none
OTEL_METRICS_EXPORTER=none
OTEL_LOGS_EXPORTER=none
# service.browser and worker.id (from WAHA_WORKER_ID) are added when available; your own values are kept
OTEL_RESOURCE_ATTRIBUTES=service.version=2026.8.2,service.engine=GOWS,service.platform=linux/x64
To actually export traces to your observability stack, set OTEL_TRACES_EXPORTER=otlp
and the standard OTEL_EXPORTER_OTLP_* variables.
Session debug level
You can enable debug mode for a session by setting the config.debug field to true when
Starting a session
This can be useful for debugging purposes when you’re experiencing issues.
{
  "name": "default",
  "config": {
    "debug": true
  }
}
Ping
Returns a simple response to check if the service is running.
GET /ping{
"message": "pong"
}Get server version
Returns the version of the installed docker image.
GET /api/server/version{
"version": "2024.2.3",
"engine": "NOWEB",
"tier": "CORE",
"browser": "/usr/bin/google-chrome-stable"
}Get server environment variables
Returns the environment variables of the server.
This endpoint returns only WAHA-related variables:
GET /api/server/environment?all=false{
"DEBUG": "1",
"WAHA_HTTP_LOG_LEVEL": "debug",
"WAHA_LOG_FORMAT": "PRETTY",
...
}To return all environment variables:
GET /api/server/environment?all=true{
"DEBUG": "1",
"WAHA_HTTP_LOG_LEVEL": "debug",
"WAHA_LOG_FORMAT": "PRETTY",
"PATH": "/home/...",
...
}Get server status
Returns the server status, start timestamp, and uptime.
GET /api/server/status{
"startTimestamp": 1723788847247,
"uptime": 3600000
}Restart (stop) server
You can stop the server by calling:
POST /api/server/stop{
// By default, it gracefully stops all sessions and connections,
// but you can force it to stop immediately
"force": false
}👉 If you’re using Docker and followed the 🔧 Install & Update guide, Docker will automatically restart the server, so you can use this endpoint to reboot the service.
Health Check
The health check endpoint is used to determine the health of the service.
GET /healthIt returns a 200 OK status code if the service is healthy.
The response format:
{
  "status": "ok",
  "info": {
    "metric1": {
      "field": "value"
    },
    "metric2": {
      "field": "value"
    }
  },
  "error": {},
  "details": {}
}
Where:
status:'error' | 'ok' | 'shutting_down'- If any health indicator failed the status will be'error'. If the app is shutting down but still accepting HTTP requests, the health check will have the'shutting_down'status.info: Object containing information of each health indicator which is of status'up', or in other words “healthy”.error: Object containing information of each health indicator which is of status'down', or in other words " unhealthy".details: Object containing detailed information of each health indicator.
Health Check Indicators
The health check monitors the following components:
- Media files storage space -
mediaFiles.space - Sessions files storage space -
sessionsFiles.space - MongoDB connection -
mongodb
Configuration
The following environment variables can be used to configure the health check:
WHATSAPP_HEALTH_MEDIA_FILES_THRESHOLD_MB- the threshold in MB for the media files storage. The default value is100.WHATSAPP_HEALTH_SESSIONS_FILES_THRESHOLD_MB- the threshold in MB for the sessions files storage. The default value is100.WHATSAPP_HEALTH_MONGODB_TIMEOUT- the timeout in milliseconds for the MongoDB health check. The default value is5000.
Examples
Healthy response when you use Local Storage for session authentication:
200 OK
{
  "status": "ok",
  "info": {
    "mediaFiles.space": {
      "status": "up",
      "path": "/tmp/whatsapp-files",
      "diskPath": "/",
      "free": 132979355648,
      "threshold": 104857600
    },
    "sessionsFiles.space": {
      "status": "up",
      "path": "/app/.sessions",
      "diskPath": "/",
      "free": 132979355648,
      "threshold": 104857600
    }
  },
  "error": {},
  "details": {
    "mediaFiles.space": {
      "status": "up",
      "path": "/tmp/whatsapp-files",
      "diskPath": "/",
      "free": 132979355648,
      "threshold": 104857600
    },
    "sessionsFiles.space": {
      "status": "up",
      "path": "/app/.sessions",
      "diskPath": "/",
      "free": 132979355648,
      "threshold": 104857600
    }
  }
}
Healthy response when you use MongoDB Storage for session authentication:
200 OK
{
  "status": "ok",
  "info": {
    "mediaFiles.space": {
      "status": "up",
      "path": "/tmp/whatsapp-files",
      "diskPath": "/",
      "free": 132977496064,
      "threshold": 104857600
    },
    "mongodb": {
      "status": "up",
      "message": "Up and running"
    }
  },
  "error": {},
  "details": {
    "mediaFiles.space": {
      "status": "up",
      "path": "/tmp/whatsapp-files",
      "diskPath": "/",
      "free": 132977496064,
      "threshold": 104857600
    },
    "mongodb": {
      "status": "up",
      "message": "Up and running"
    }
  }
}
Unhealthy response example
503 Service Unavailable
{
  "status": "error",
  "info": {
    "mediaFiles.space": {
      "status": "up",
      "path": "/tmp/whatsapp-files",
      "diskPath": "/",
      "free": 132976623616,
      "threshold": 104857600
    }
  },
  "error": {
    "mongodb": {
      "status": "down",
      "error": "Timeout"
    }
  },
  "details": {
    "mediaFiles.space": {
      "status": "up",
      "path": "/tmp/whatsapp-files",
      "diskPath": "/",
      "free": 132976623616,
      "threshold": 104857600
    },
    "mongodb": {
      "status": "down",
      "error": "Timeout"
    }
  }
}
Prometheus Metrics
WAHA can expose metrics in Prometheus text format.
The endpoint is disabled by default - enable it with the environment variable:
WAHA_PROMETHEUS_ENABLED=TrueGET /metrics# HELP waha_up 1 if the WAHA process is serving Prometheus metrics
# TYPE waha_up gauge
waha_up 1
# HELP waha_info WAHA build information
# TYPE waha_info gauge
waha_info{version="2026.8.2",tier="CORE",engine="GOWS",platform="linux/x64"} 1
# HELP waha_sessions WhatsApp sessions by status and engine
# TYPE waha_sessions gauge
waha_sessions{status="WORKING",engine="GOWS"} 1
# HELP waha_session_status Current status per session (1 = session is in this status)
# TYPE waha_session_status gauge
waha_session_status{session="default",status="WORKING",engine="GOWS"} 1
...Metrics
waha_up- always1when the endpoint is enabled and the process is running.waha_info{version, tier, engine, platform}- WAHA build information, always1.waha_http_requests_total{method, status}- API HTTP requests handled by WAHA.waha_http_request_duration_seconds{method, status}- API HTTP request duration histogram (in seconds).
All API (/api) and MCP (/mcp) requests are tracked, including file serving routes
(/api/files/, /api/s3/) - static routes (dashboard, jobs) are ignored.
waha_sessions{status, engine}- number of sessions by status and engine (collected at scrape time).waha_session_status{session, status, engine}- current status per session, always1- the session’s status is in thestatuslabel (STOPPED sessions included).waha_session_status_change_timestamp_seconds{session}- unix timestamp of the last session status change. How long the session is in the current status:time() - waha_session_status_change_timestamp_seconds.waha_session_activity_timestamp_seconds{session}- unix timestamp of the last session activity.waha_events_total{session, event}- WAHA events counted per session - the tracked events are controlled byWAHA_PROMETHEUS_TRACK_EVENTS.- Default Node.js process metrics (CPU, memory, event loop, GC) with the same
waha_prefix - includingwaha_process_start_time_seconds(unix timestamp of the server start).
All metrics get an additional worker label with the WAHA_WORKER_ID value (an empty string if it’s not set).
Configuration
WAHA_PROMETHEUS_ENABLED- enable the metrics endpoint. The default value isFalse- when disabled,GET /metricsreturns 404 Not Found.WAHA_PROMETHEUS_PATH- the endpoint path. The default value is/metrics.WAHA_PROMETHEUS_METRIC_PREFIX- the prefix for all metric names. The default value iswaha_.WAHA_PROMETHEUS_HTTP_DURATION_BUCKETS- comma-separated histogram buckets in seconds forwaha_http_request_duration_seconds. The default value is0.005,0.01,0.025,0.05,0.1,0.25,0.5,1,2.5,5,10,30.WAHA_PROMETHEUS_TRACK_EVENTS- comma-separated list of 🔄 Events to count inwaha_events_total. The default value ismessage.any. Use*to track all events, or prefix wildcards likemessage.*andgroup.*. 👉 The server actively subscribes to and processes the listed events (including media downloads for message events) even if no webhook or websocket consumes them.WAHA_PROMETHEUS_USERNAMEandWAHA_PROMETHEUS_PASSWORD- optional basic auth for the endpoint, see below.
Authentication
Like /ping, the metrics endpoint is not protected by the API key, so in-cluster scrapers can collect it
without extra configuration.
If the endpoint is exposed publicly, protect it with basic auth by setting both variables:
WAHA_PROMETHEUS_USERNAME=admin
WAHA_PROMETHEUS_PASSWORD=secretcurl -u admin:secret http://localhost:3000/metricsScrape Configuration
scrape_configs:
  - job_name: waha
    static_configs:
      - targets: ["localhost:3000"]
    # Only if WAHA_PROMETHEUS_USERNAME and WAHA_PROMETHEUS_PASSWORD are set
    basic_auth:
      username: admin
      password: secret
Troubleshooting
There’s few internal tools to help us (as developers) understand what it’s going on under the hood. The below section you can use if you have any problem, and we asked to collect additional information.
Enable Debug Mode
By default, debug mode is off.
Enable it by adding WAHA_DEBUG_MODE environment variable:
WAHA_DEBUG_MODE=TrueALL - node heapsnapshot
Works with all engines: WEBJS, GOWS, NOWEB
- Add
WAHA_DEBUG_MODE=Trueenv variable - Restart container
- Execute request (only when the issue’s happening to collect the most recent information)
GET /api/server/debug/heapsnapshot- Send the file to the developers or open
about://inspectin Chrome to analyze the heap
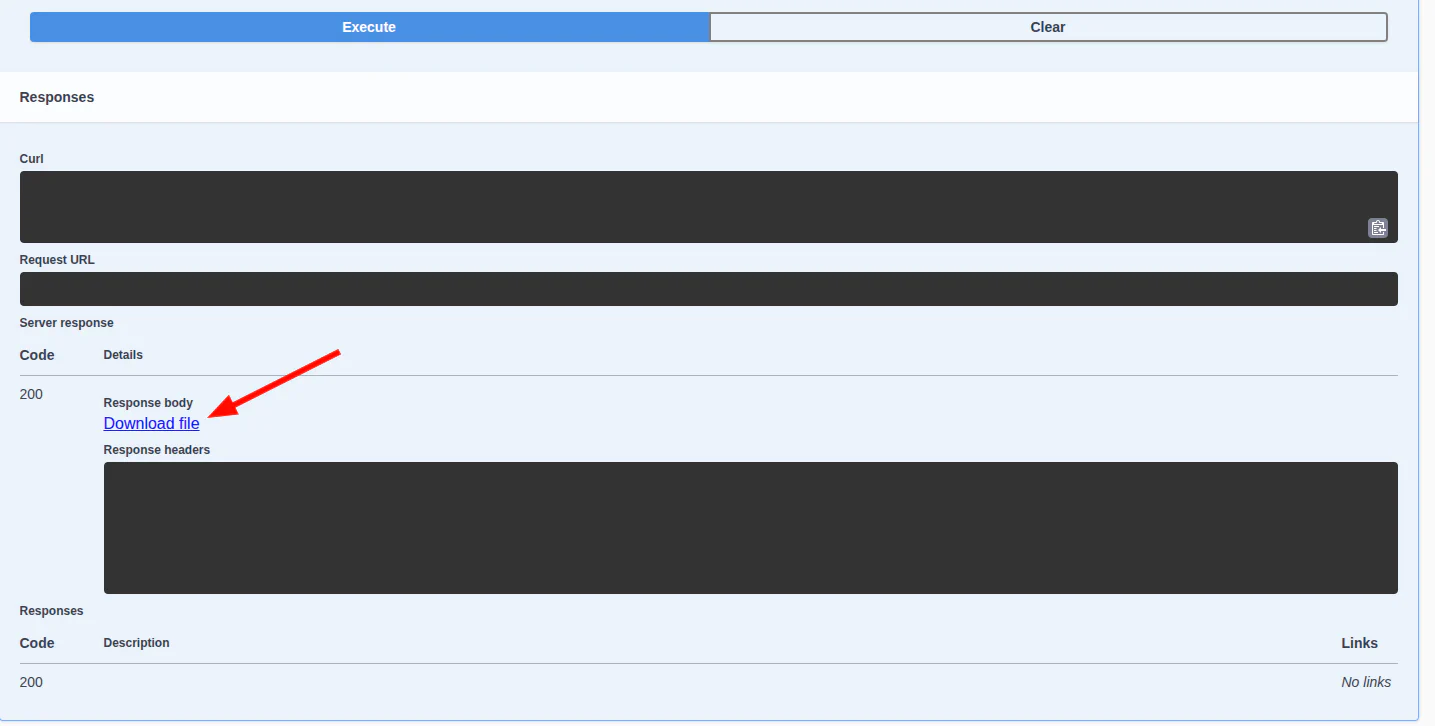
You can execute request in 📚 Swagger, then click on Download File:
ALL - node cpu profiling
Works with all engines: WEBJS, GOWS, NOWEB
- Add
WAHA_DEBUG_MODE=Trueenv variable - Restart container
- Execute request (only when the issue’s happening to collect the most recent information)
GET /api/server/debug/cpu?seconds=30- Send the file to the developers or open
about://inspectin Chrome to analyze the profile
WEBJS - Get Browser Trace
Works only with WEBJS engine
- Add
WAHA_DEBUG_MODE=Trueenv variable - Restart container
- Execute request (only when the issue’s happening to collect the most recent information)
GET /api/server/debug/browser/trace/{SESSION}?seconds=30&categories=%2AGet browser’s trace (uses puppeteer) which you can open in Chrome Dev Tool (chrome://tracing) or https://trace.cafe/.
Query Parameters:
seconds- how many seconds to tracecategories- categories to trace
- 👉 Only one trace can be active at a time per browser.
- ⌛ It takes
SECONDSseconds to generate the trace file, please be patient 🐢
You can execute request in 📚 Swagger, then click on Download File:
GOWS - pprof
Works only with GOWS engine
- Add
WAHA_DEBUG_MODE=Trueenv variable - Expose
6060port from the docker (see yaml below)
services:
  waha:
    image: devlikeapro/waha
    ports:
- "127.0.0.1:6060:6060"- Restart container
- Use
curlto collect heap when issue is happening
curl -s http://localhost:6060/debug/pprof/heap > heap.pb.gz- Send
heap.pb.gzto developers or analyze it using
go tool pprof -http=:8081 ./heap.pb.gz- OR you can connect and debug it online using built-in http server:
go tool pprof -http=:8081 http://localhost:6060/debug/pprof/heap